July 2026 Tourism Review: The Visitors Returned, but Utilisation Did Not
03 Aug 2026, 19:35 · by IzuCT · 6 min read · Tourism · EN

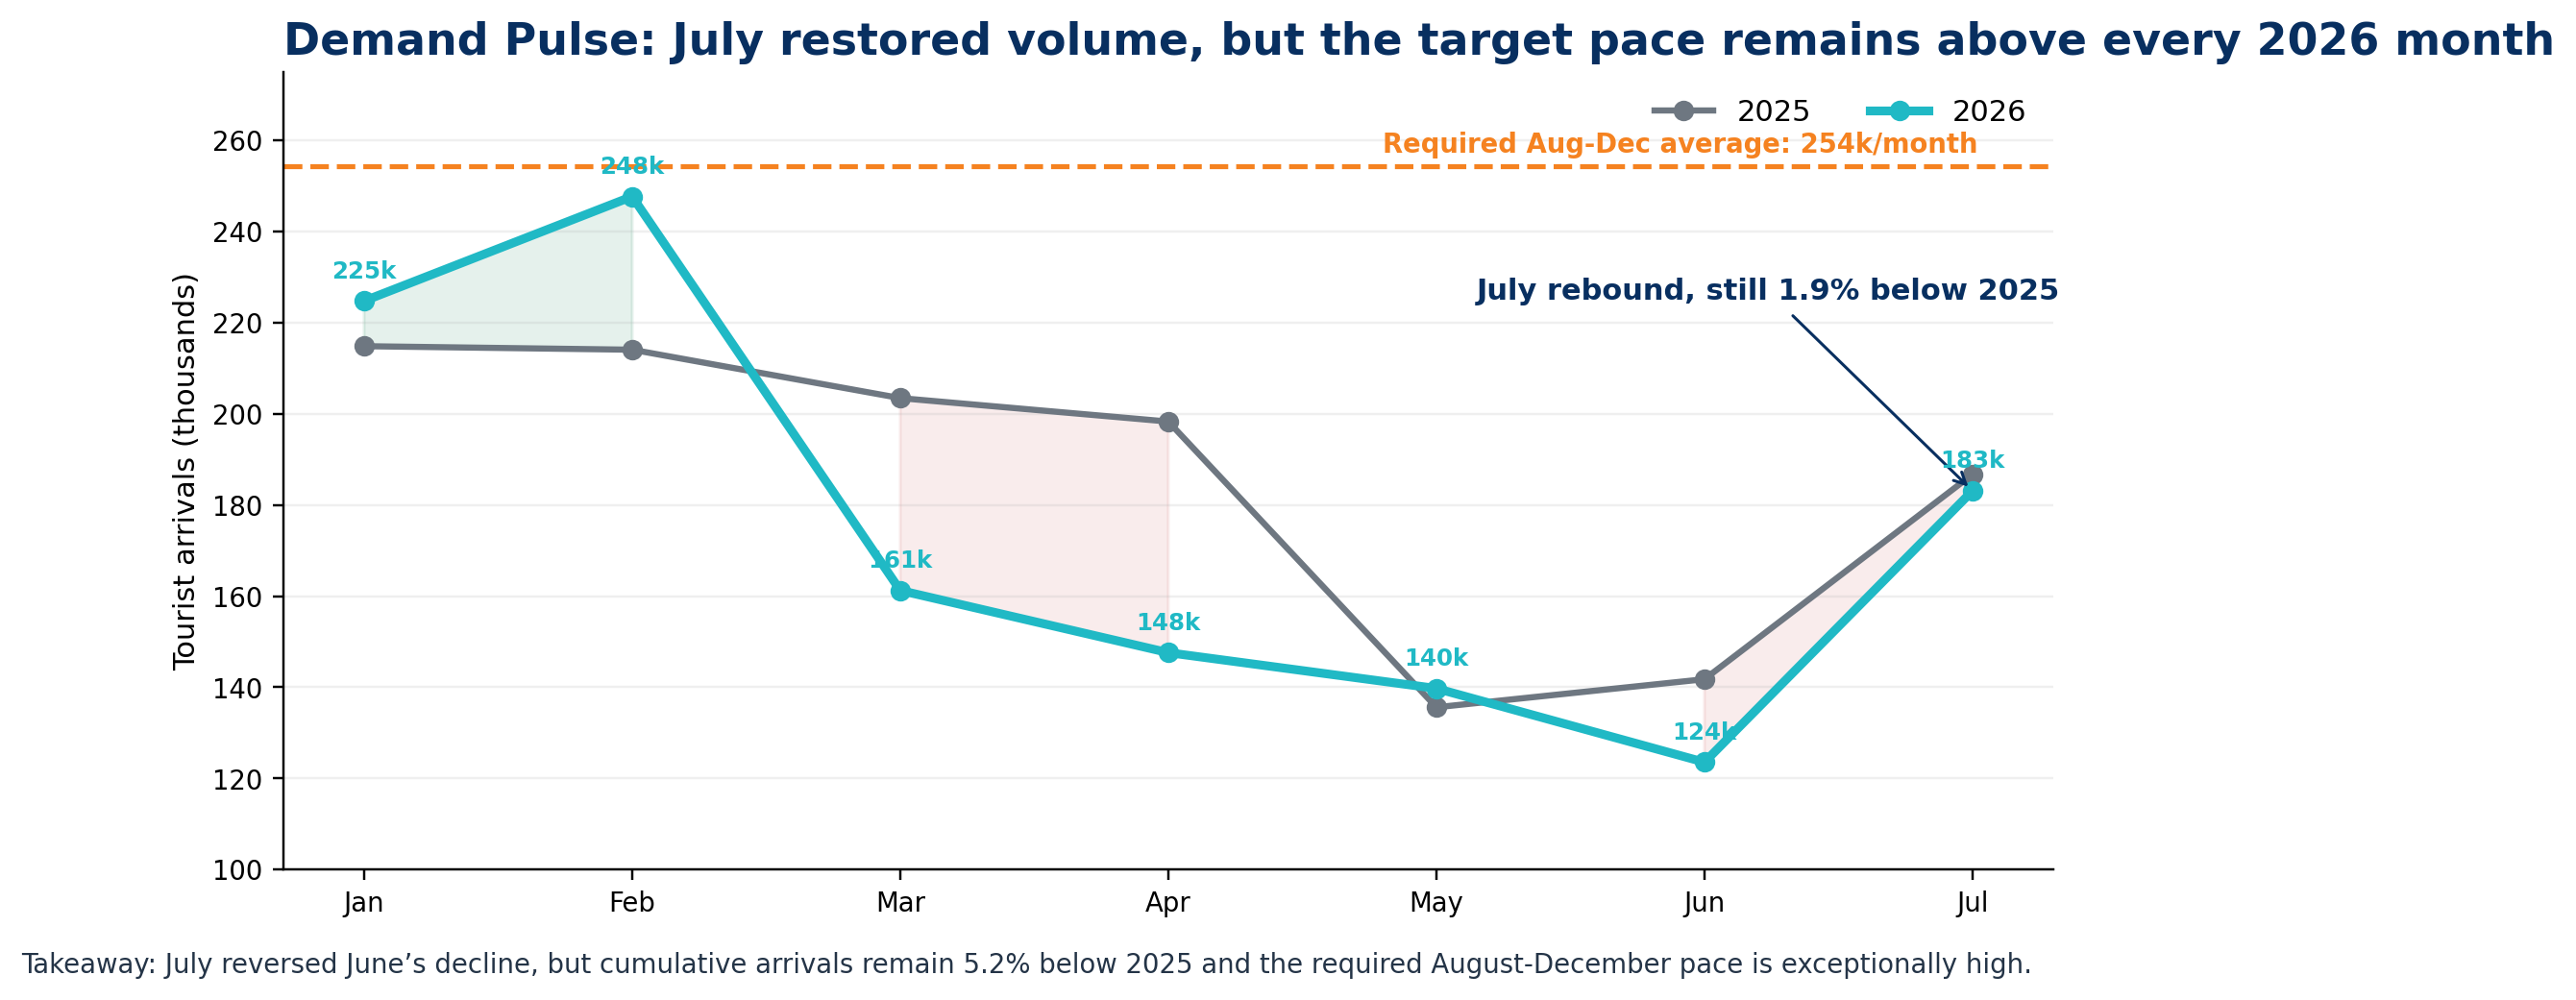
July gave the Maldives tourism industry something June did not: a visible rebound in visitor volume. Arrivals rose from 123,552 in June to 183,119 in July. That is an important improvement, and it changes the mood entering August.
Free tourism insights
Get Free Tourism Insights
Receive selected MTO insights, tourism data alerts, and new resource updates by email.
Get Free Tourism InsightsIn July the deeper story is more demanding. July was still 1.9% below July 2025, and cumulative arrivals for January to July reached 1,227,786, which is 5.2% below the same period last year. More importantly, the latest accommodation data, which currently lag one month behind and run to June 2026, show that the tourism system is still carrying a heavy utilisation burden. Overall occupancy in June was only 40.4%, while the Capacity Pressure Index (CPI) rose to 2.48x, its highest reading of the year so far.
That means July should be read as a recovery in monthly demand, not yet a recovery in tourism system performance.
Figure 1. Demand Pulse Chart
Takeaway: July restored momentum after June, but the annual target runway became steeper.
A stronger month, but a harder target
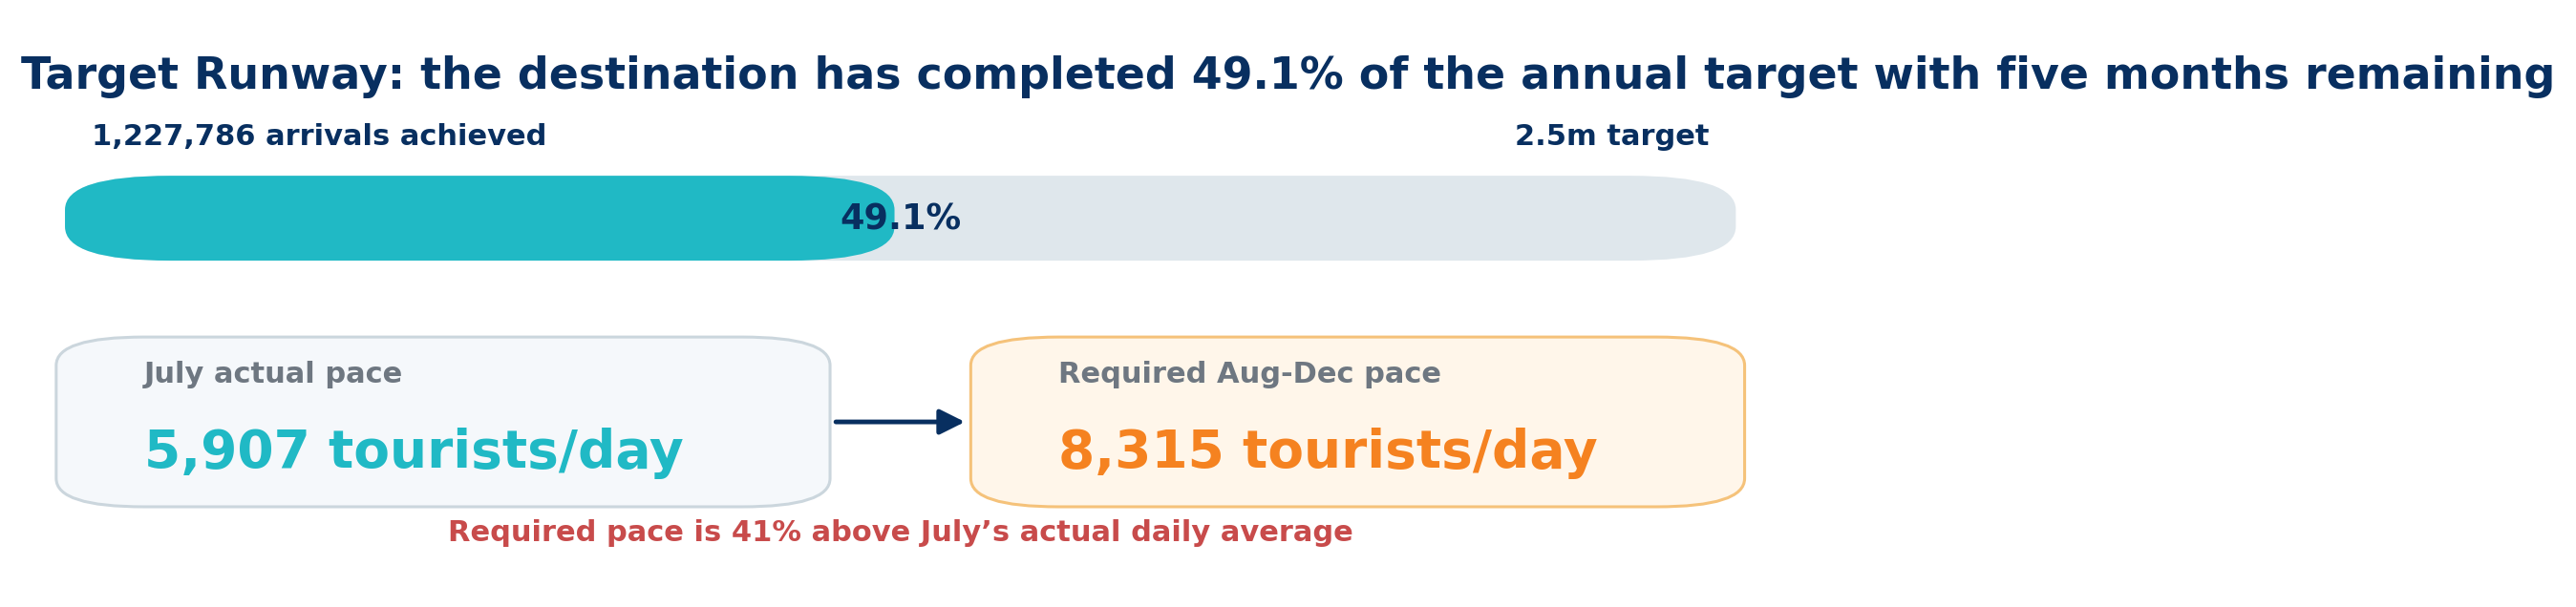
The Government’s annual tourism target remains 2.5 million arrivals in 2026. After July, the Maldives still needs 1,272,214 additional tourists between August and December. With 153 days remaining, that implies a required average of 8,315 arrivals per day.
July’s actual daily average was 5,907.
In other words, the destination now needs a daily pace about 41% higher than July’s actual performance to reach the annual target. That does not make the target impossible. But it does mean the second half of the year cannot rely on passive seasonality. It will require a stronger-than-normal fourth quarter, limited slippage in August and September, and better conversion of available seats into confirmed travel.
Figure 2. Target Runway Graphic
Takeaway: The target is still mathematically possible, but the catch-up pace is becoming increasingly demanding.
For industry stakeholders, this changes the strategic question. It is no longer enough to ask whether arrivals improved from one month to the next. The relevant question is whether the current pace is strong enough to close the target gap without damaging yield.
The source-market story is becoming uneven
The second major July signal is the structure of demand. The Maldives is still attracting scale, but it is doing so from a narrower set of engines.
Like-for-like Ministry daily updates through 28 July show that China and Russia remain the two dominant growth markets. China reached 211,684 arrivals, up 14.6% year on year, while Russia reached 176,732, up 17.3%. These two markets are now doing much of the volume work.
The picture is weaker elsewhere. The United Kingdom was down 19.6%, Italy down 14.6%, Germany down 16.3%, France down 15.8%, and the United States down 22.0%. India was comparatively stable, but still slightly lower at -4.9%.
This matters because not all markets contribute in the same way. Some are more important for resort occupancy and yield, others for guesthouse volume, and others for seasonal resilience. A portfolio that increasingly depends on two large markets may keep total arrivals moving, but it also increases exposure to route risk, exchange-rate shifts, geopolitical uncertainty and outbound policy changes.
Figure 3. Source-Market Momentum Quadrant
Takeaway: China and Russia are large and growing; most major Western markets remain large but weakening.
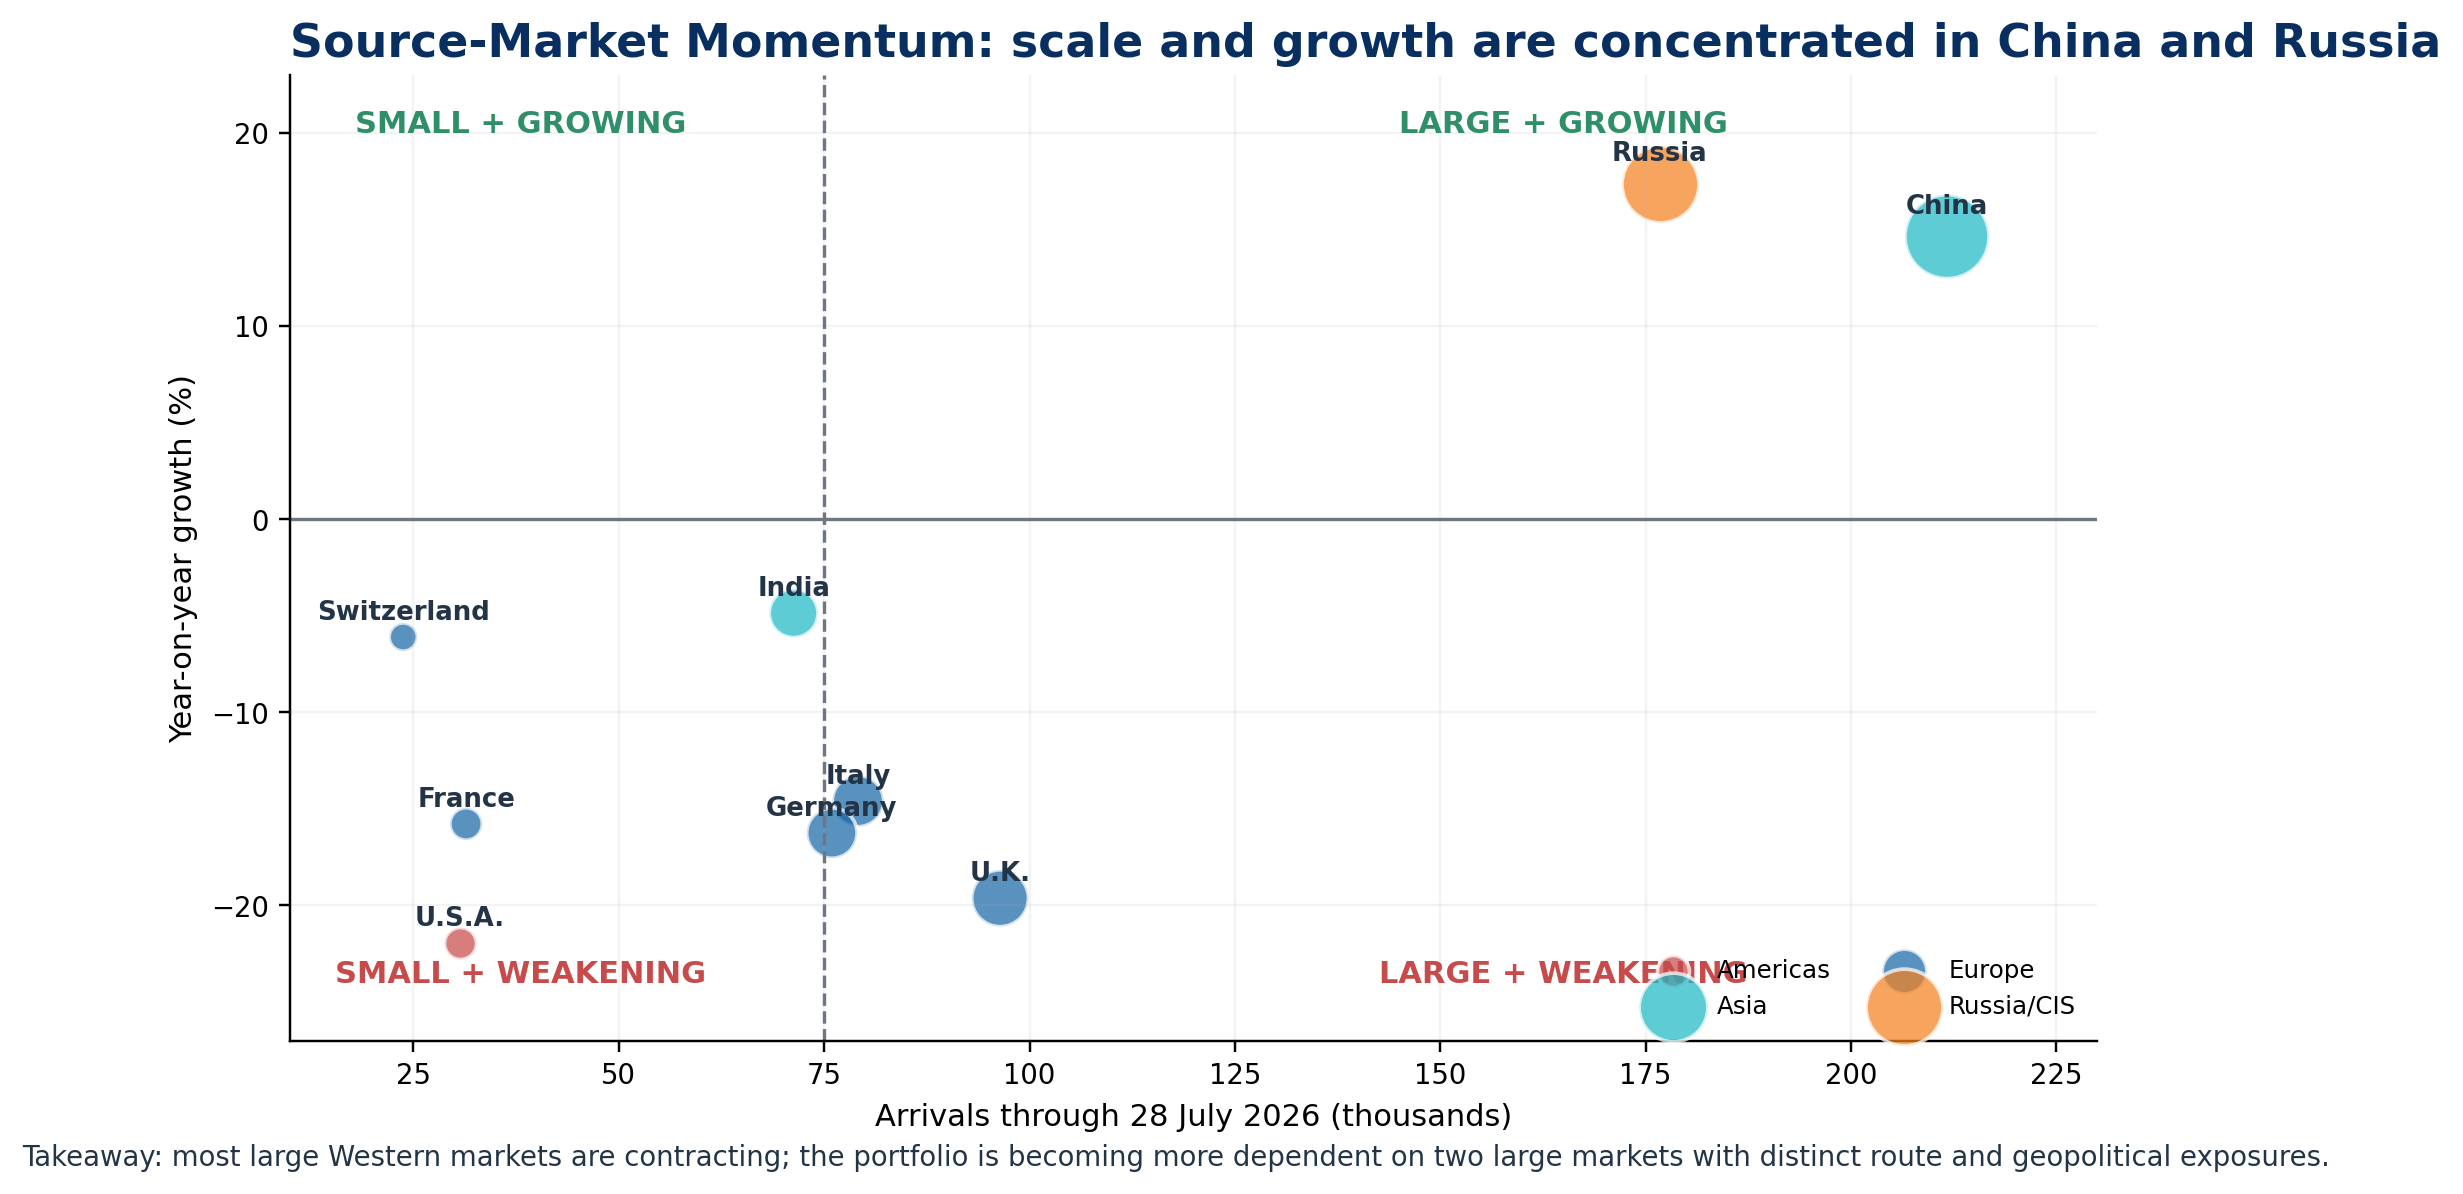
For August and September, this suggests a clear priority: protect the scale markets, but do not let the recovery strategy become a two-market strategy. The Maldives still needs stronger re-engagement with weaker high-value Western corridors, while also strengthening India and other shorter-haul opportunities.
The real warning is not arrivals. It is utilisation.
The strongest analytical message from the July review sits in the accommodation data.
While July arrivals are already available, the latest full accommodation indicators extend only through June 2026. That June data shows:
Bed nights sold: 822,000
Bed-night capacity: 2.036 million
Overall occupancy: 40.4%
Shadow inventory: approximately 1.214 million bed nights
Capacity Pressure Index: 2.48x
The CPI is especially important. It is calculated as:
Bed-night capacity ÷ bed nights sold
A CPI of 1.00x means full utilisation.
A CPI above 1.50x signals rising spare capacity.
A CPI above 2.00x is a serious warning.
At 2.48x, June tells us that the tourism system had nearly two and a half units of available bed-night capacity for every one unit actually sold. That is not just an occupancy issue. It is a profitability, pricing and resilience issue.
Figure 4. Capacity Pressure Index Trend
Takeaway: Capacity pressure has worsened steadily through 2026, despite the rebound in arrivals.
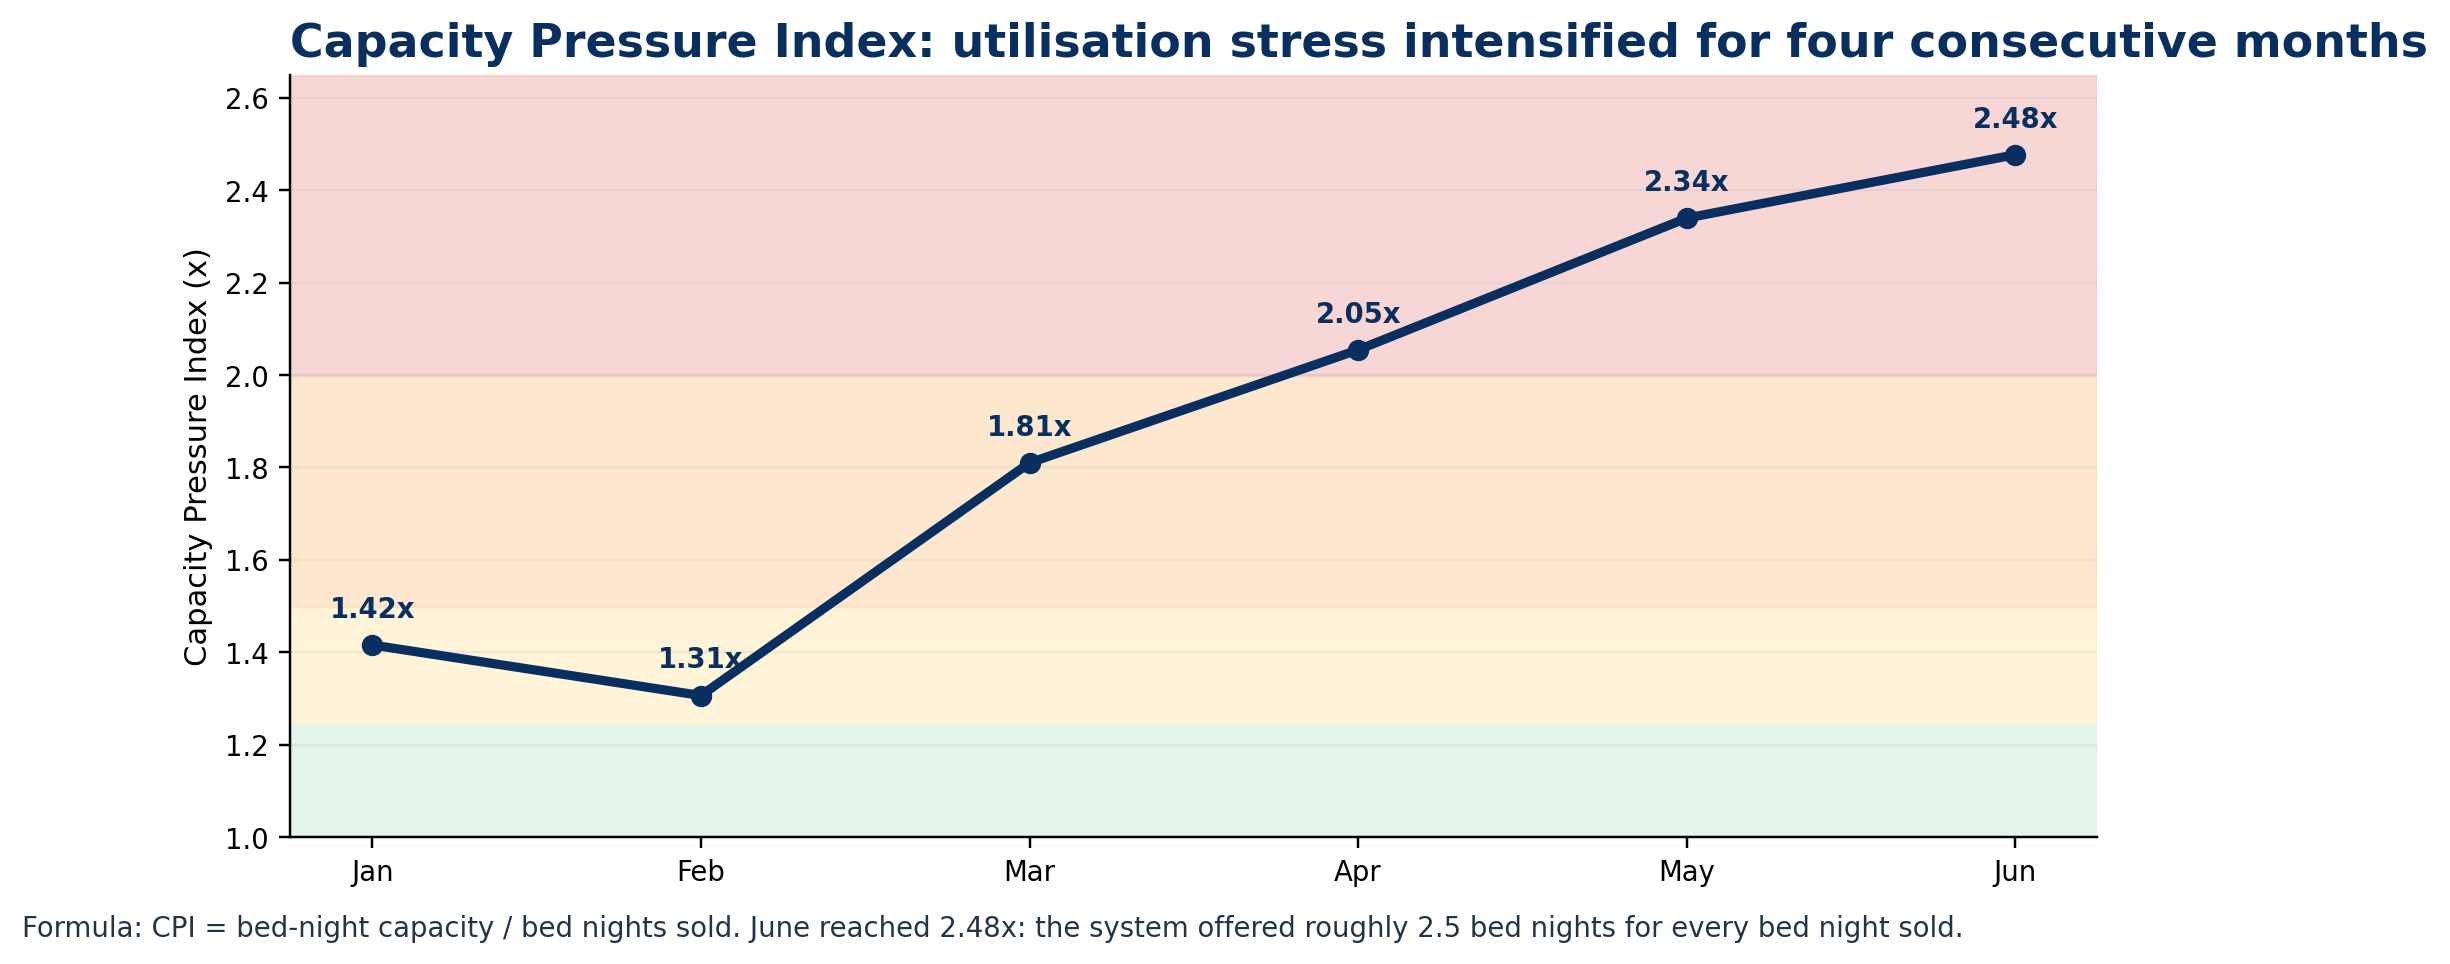
Figure 5. Shadow Inventory Area Chart
Takeaway: Unsold capacity is rising faster than the system can absorb, especially in the low season.
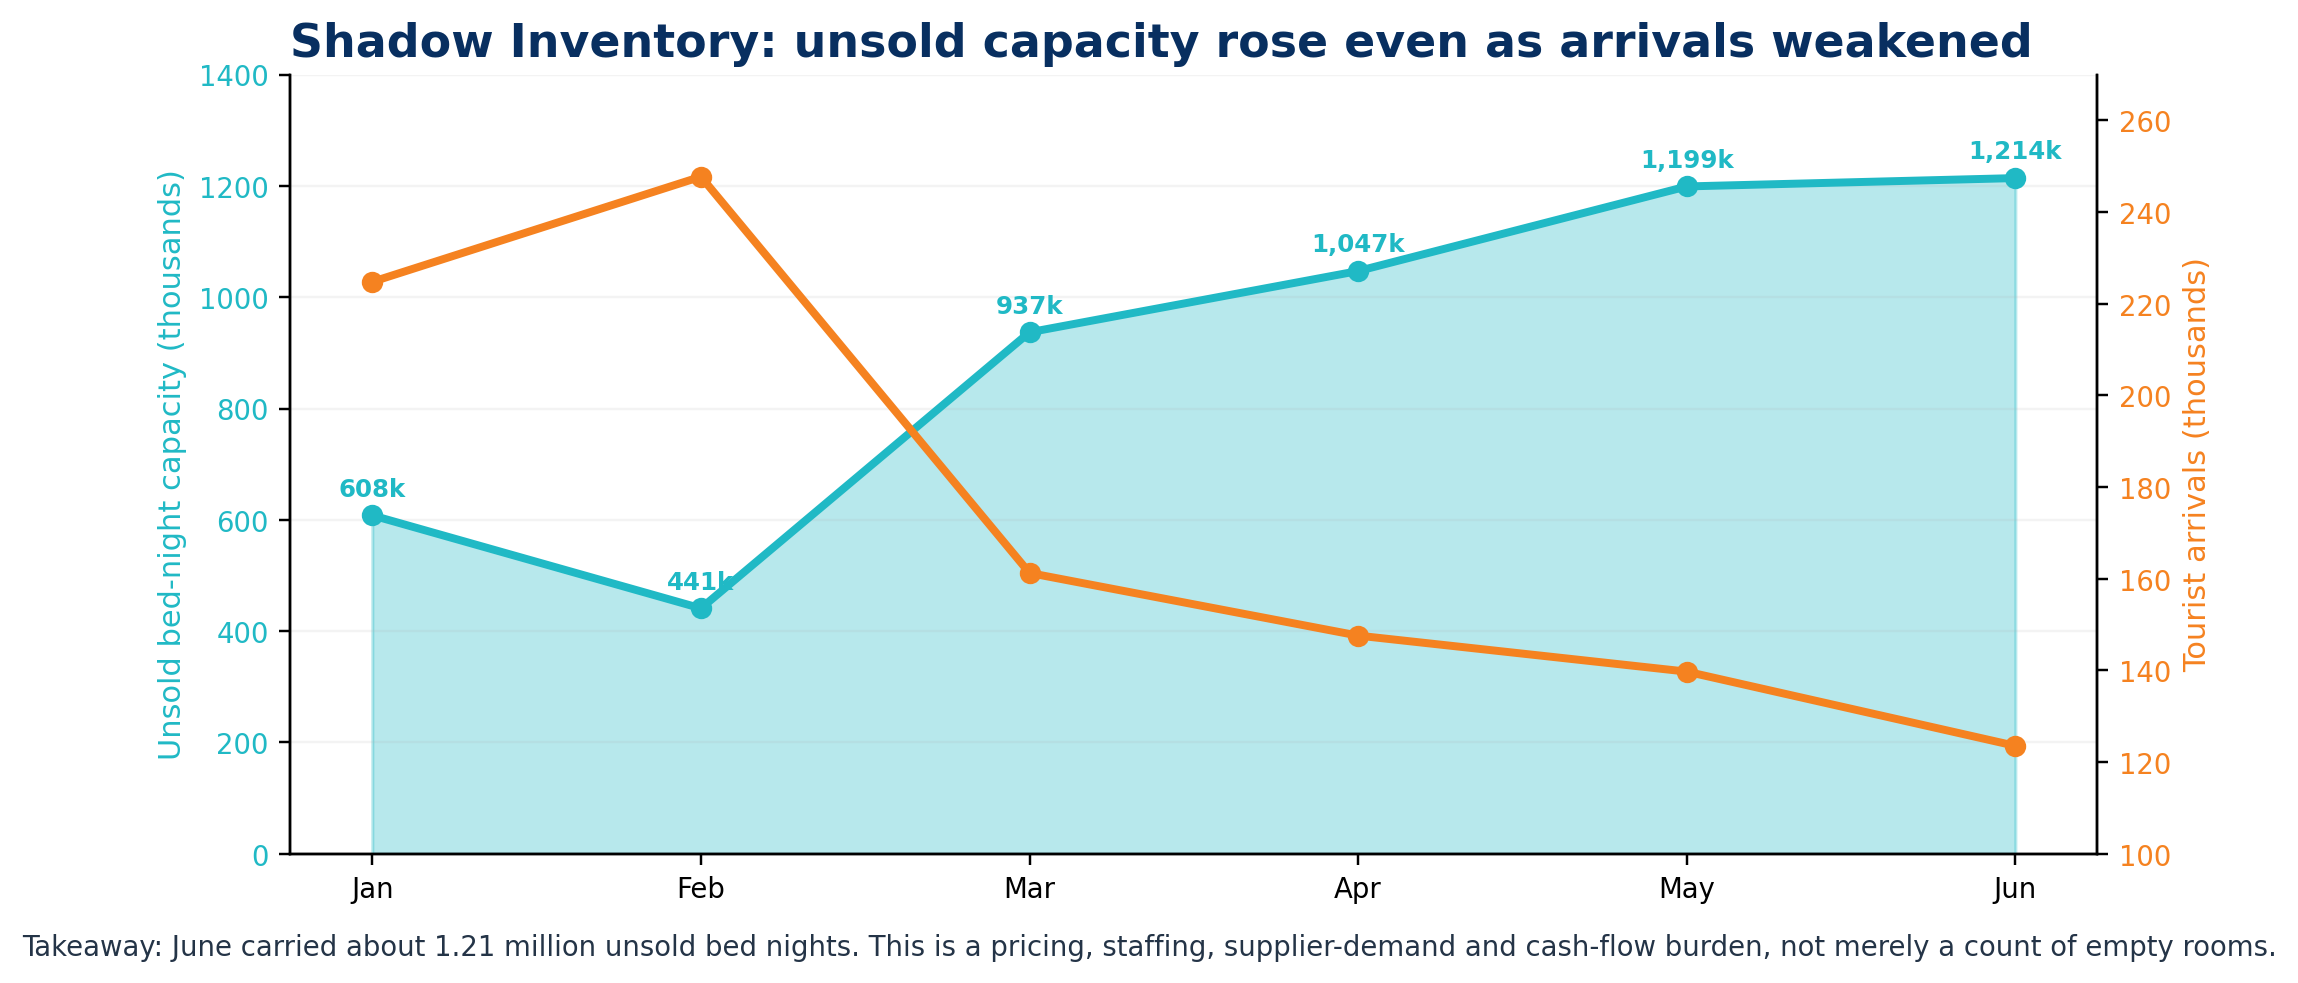
Shadow inventory should not be understood simply as empty rooms. It is the unsold capacity carried by the tourism system. It affects discounting behaviour, staff productivity, supplier demand, tax conversion and foreign-exchange earnings. When shadow inventory exceeds one million bed nights in a month, the issue is no longer just weak volume. It becomes a structural utilisation problem.
Why this matters for revenue and the wider economy
Tourism performance reaches public finance through a chain: arrivals influence stay length, occupied bed nights, occupancy, spending, taxes, airport charges, resort rent and foreign-exchange liquidity.
MIRA collected MVR 2.92 billion in June 2026, 10.1% above June 2025 and 14.7% above forecast. TGST contributed MVR 1.08 billion, resort rent MVR 411 million, Green Tax MVR 157 million, and Airport Development Fee plus Departure Tax MVR 269 million. USD collections reached USD 118.60 million.
Yet this should not be read too simply. MIRA also noted that 14.3% of monthly revenue came from past-due payments, 23.4% was secured through recovery activity, and one-off receipts also contributed. So the June revenue headline is not a clean indicator of current tourism strength.
Figure 6. Fiscal Transmission Visual
Takeaway: Tourism value enters the Treasury through occupied nights and spending, not through arrivals alone.
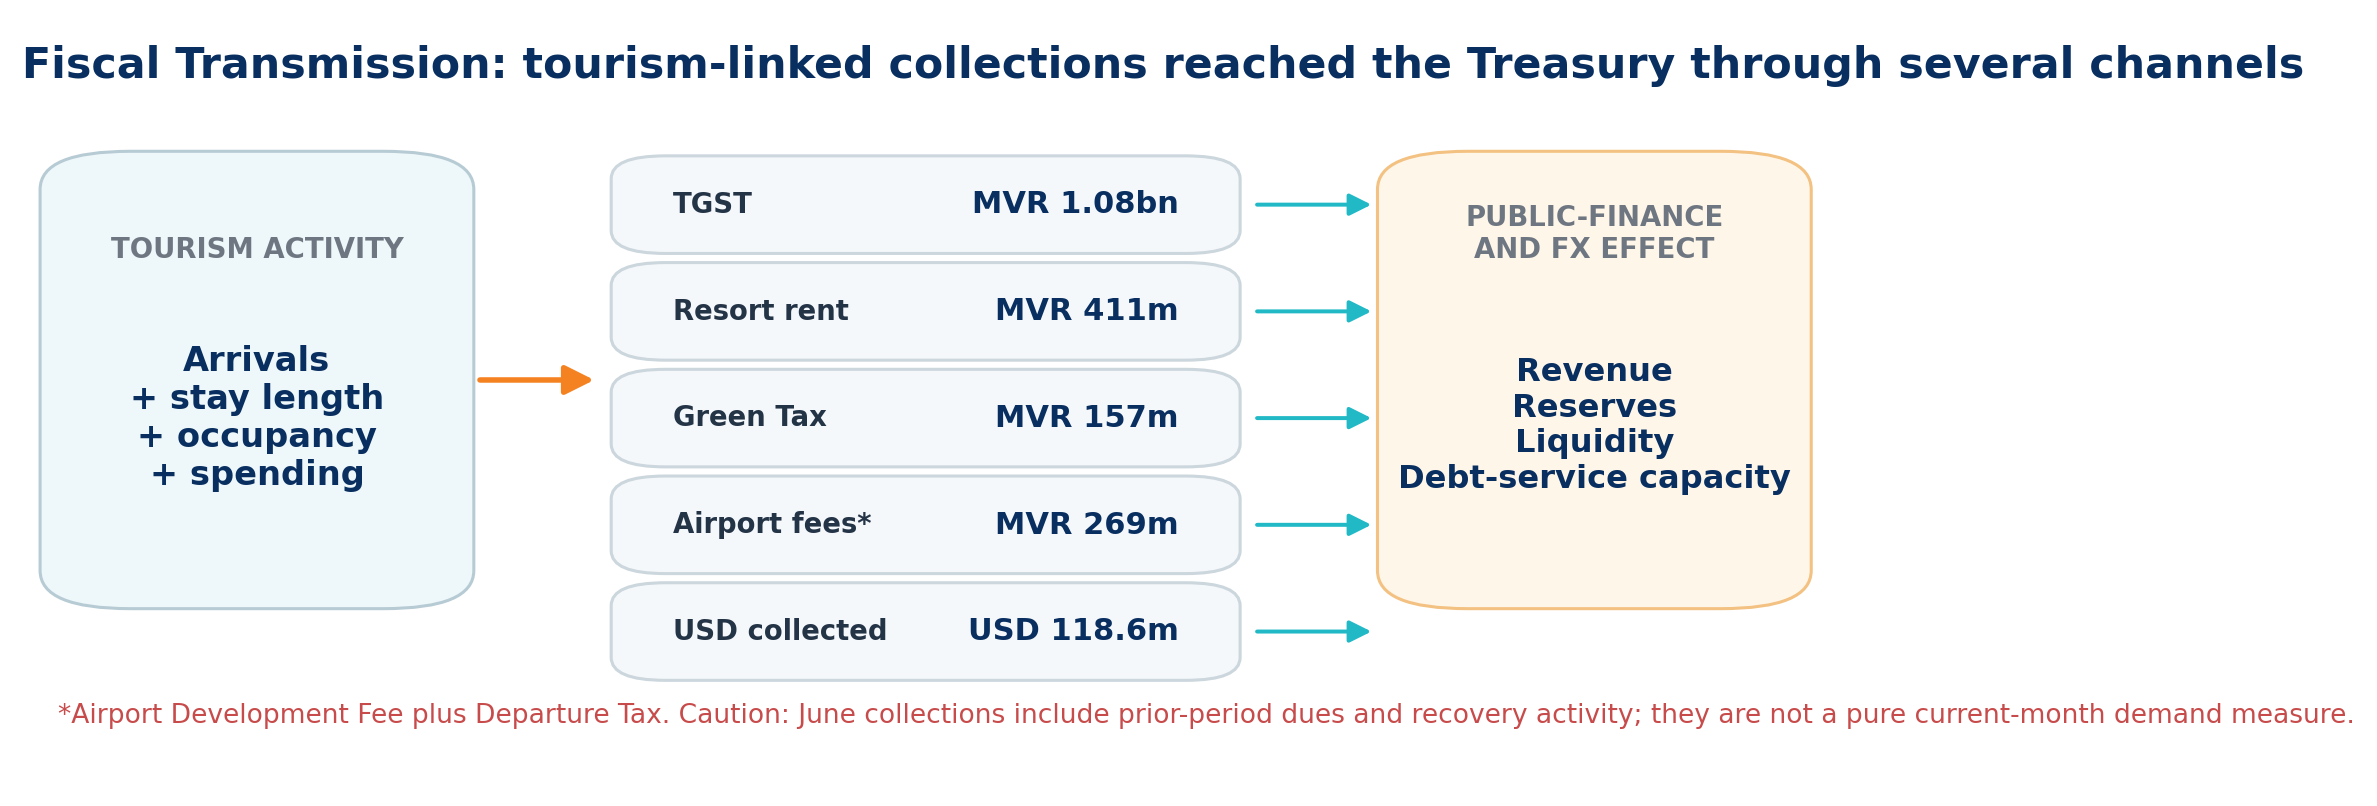
The practical point is clear: arrivals alone do not guarantee revenue quality. A month with recovering visitor numbers can still underperform if bed nights, occupancy and spending remain weak.
What industry stakeholders should do now
The July review points to five practical priorities.
First, protect air access.
Tourism recovery in the Maldives is route-dependent. Government and industry should monitor seat supply, disruptions, cancellations and route recovery weekly, not monthly.
Second, defend August–September demand without broad discounting.
Blanket price cuts can fill some rooms, but they also damage yield and destination positioning. Better tools are fenced value-adds, transfer-inclusive offers, route-based promotions and targeted booking windows.
Third, diversify the recovery.
China and Russia matter, but a durable recovery needs stronger performance from the UK, Germany, Italy, France, the US and India.
Fourth, manage for utilisation, not just volume.
Operators should track occupancy, average stay, CPI, shadow inventory, ADR and RevPAR together. Staffing and procurement decisions should be based on realistic utilisation, not only headline arrival numbers.
Fifth, improve guesthouse resilience.
For local-island operators, the immediate edge may come from better transport information, stronger direct booking conversion, improved packaging of activities, and better coordination around low-season demand.