Maldives Tourism Brief: August’s Recovery Was Real. But Ended with a Warning
02 Sep 2026, 11:07 · by IzuCT · 7 min read · Updates · EN

August 2026 recorded 197,640 tourists. Read alongside daily momentum, the annual gap, source-market concentration and accommodation utilisation, the month reveals a tourism system moving at several speeds.
For a full reviews of the August vist https://hub.izuct.com/mto/free-briefs
A monthly tourism total is like a photograph of the ocean. It captures the waterline clearly, but freezes the currents moving beneath it.
August 2026 produced a reassuring photograph. The Maldives received 197,640 tourists, 2.1% more than in the comparable month of 2025.
But the current underneath that total changed direction.
August began with relatively strong daily momentum and ended considerably slower. That does not erase the month’s recovery. It changes how the recovery should be interpreted.
The important question is therefore no longer simply whether August was up or down. It is whether the momentum, utilisation and composition behind those arrivals leave the tourism system stronger as September begins.
A shape, not just a total
August began at an average of 6,851 arrivals a day during its opening 7 observations and closed at 5,180 during the final 7. That is a -24.4% shift inside the same month. The high point was 7,879 on day 8; the low was 4,551 on day 30. These are not decorative details. For airlines, transfers, resorts and guesthouses, a monthly total describes accumulated volume, while the closing pace describes the direction in which the operating system was travelling when the calendar turned.
This distinction changes the interpretation. A positive year-on-year result can coexist with a softening finish because totals remember the whole month, whereas momentum gives greater weight to its final days. The relationship resembles a spacecraft that has travelled a long distance but is now changing velocity: position and motion are both true, but they answer different questions. The data supports the observation of a late slowdown. It does not prove whether flight schedules, holidays, pricing or booking behaviour caused it.
August recovered, but lost speed
During the opening seven observations of August, arrivals averaged 6,851 tourists per day. During the final seven, the average had fallen to 5,180.
That is a 24.4% decline in pace within the same month.
The highest daily reading was 7,879 on day 8. The lowest was 4,551 on day 30.
Earlier in the month, the picture looked different. In the mid-August tourism brief, the seven-day average was still running above the pace required to reach the annual target. By the third-week assessment, that cushion remained positive, but history suggested that September could test it.
The final week removed the cushion.
Figure 1 — Monthly Pace
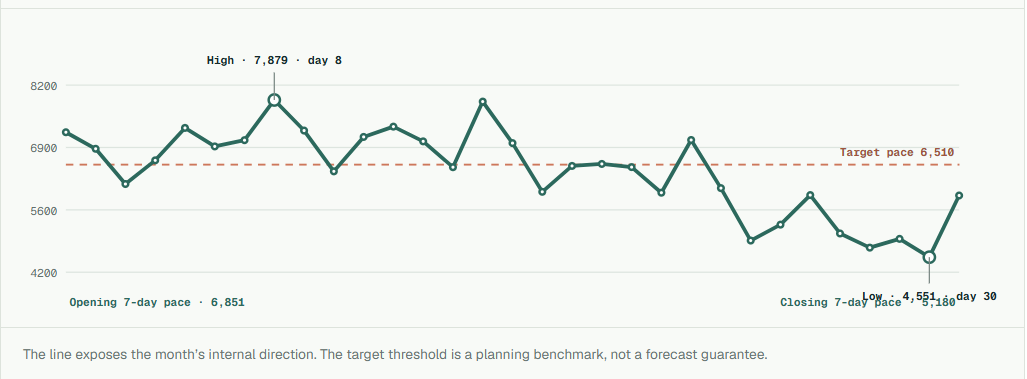
The monthly total and the closing pace are not contradictory. They measure different things. A monthly total is similar to distance travelled. Momentum is velocity. A spacecraft can have travelled a long way and still be slowing down. In the same way, August can finish 1.7% above last year while the tourism system enters September moving at a considerably weaker daily rate.
The data shows that the slowdown occurred. It does not, by itself, establish whether air capacity, holiday calendars, prices, weather, booking behaviour or other factors caused it.
Three clocks are now running
There are now three useful ways to read Maldives tourism performance. The monthly clock says August was strong: 197,640 arrivals, up 5.2%. The annual clock says the recovery is incomplete: cumulative 2026 arrivals reached 1,452,257, still 2.1% below the comparable 2025 position. The forward clock asks what must happen next.
From 1 September, the Maldives needs approximately 6,510 tourists per day to reach the 2,246,516 year-end target. The final seven-day average of 5,180 was therefore about 20.4% below the required pace. That does not mean the target has been lost. It means the earlier pace advantage has disappeared.
None of these clocks cancels the others. August improved the annual position. The year remains behind. And the month ended below the trajectory required from September onward.
All three statements are true.
The central forecast remains below the target
The month-end forecast provides another way to separate what has already happened from what may happen next.
Using completed August data, the MTO central model projects approximately 2,190,900 arrivals for 2026.
That is 55,616 below the 2,246,516 target.
The model deliberately does not allow the final week to determine the whole year. It gives 80% weight to the current YTD year-on-year position, with 10% each assigned to the August daily average and the final seven-day pace.
Those three signals individually imply full-year outcomes of approximately:
2,199,339 from the YTD position;
2,230,066 from the August average pace; and
2,084,217 from the closing seven-day pace.
The central forecast sits between them because the future is unlikely to behave exactly like any single signal.
Figure 2 — Full-Year Forecast and Planning Range
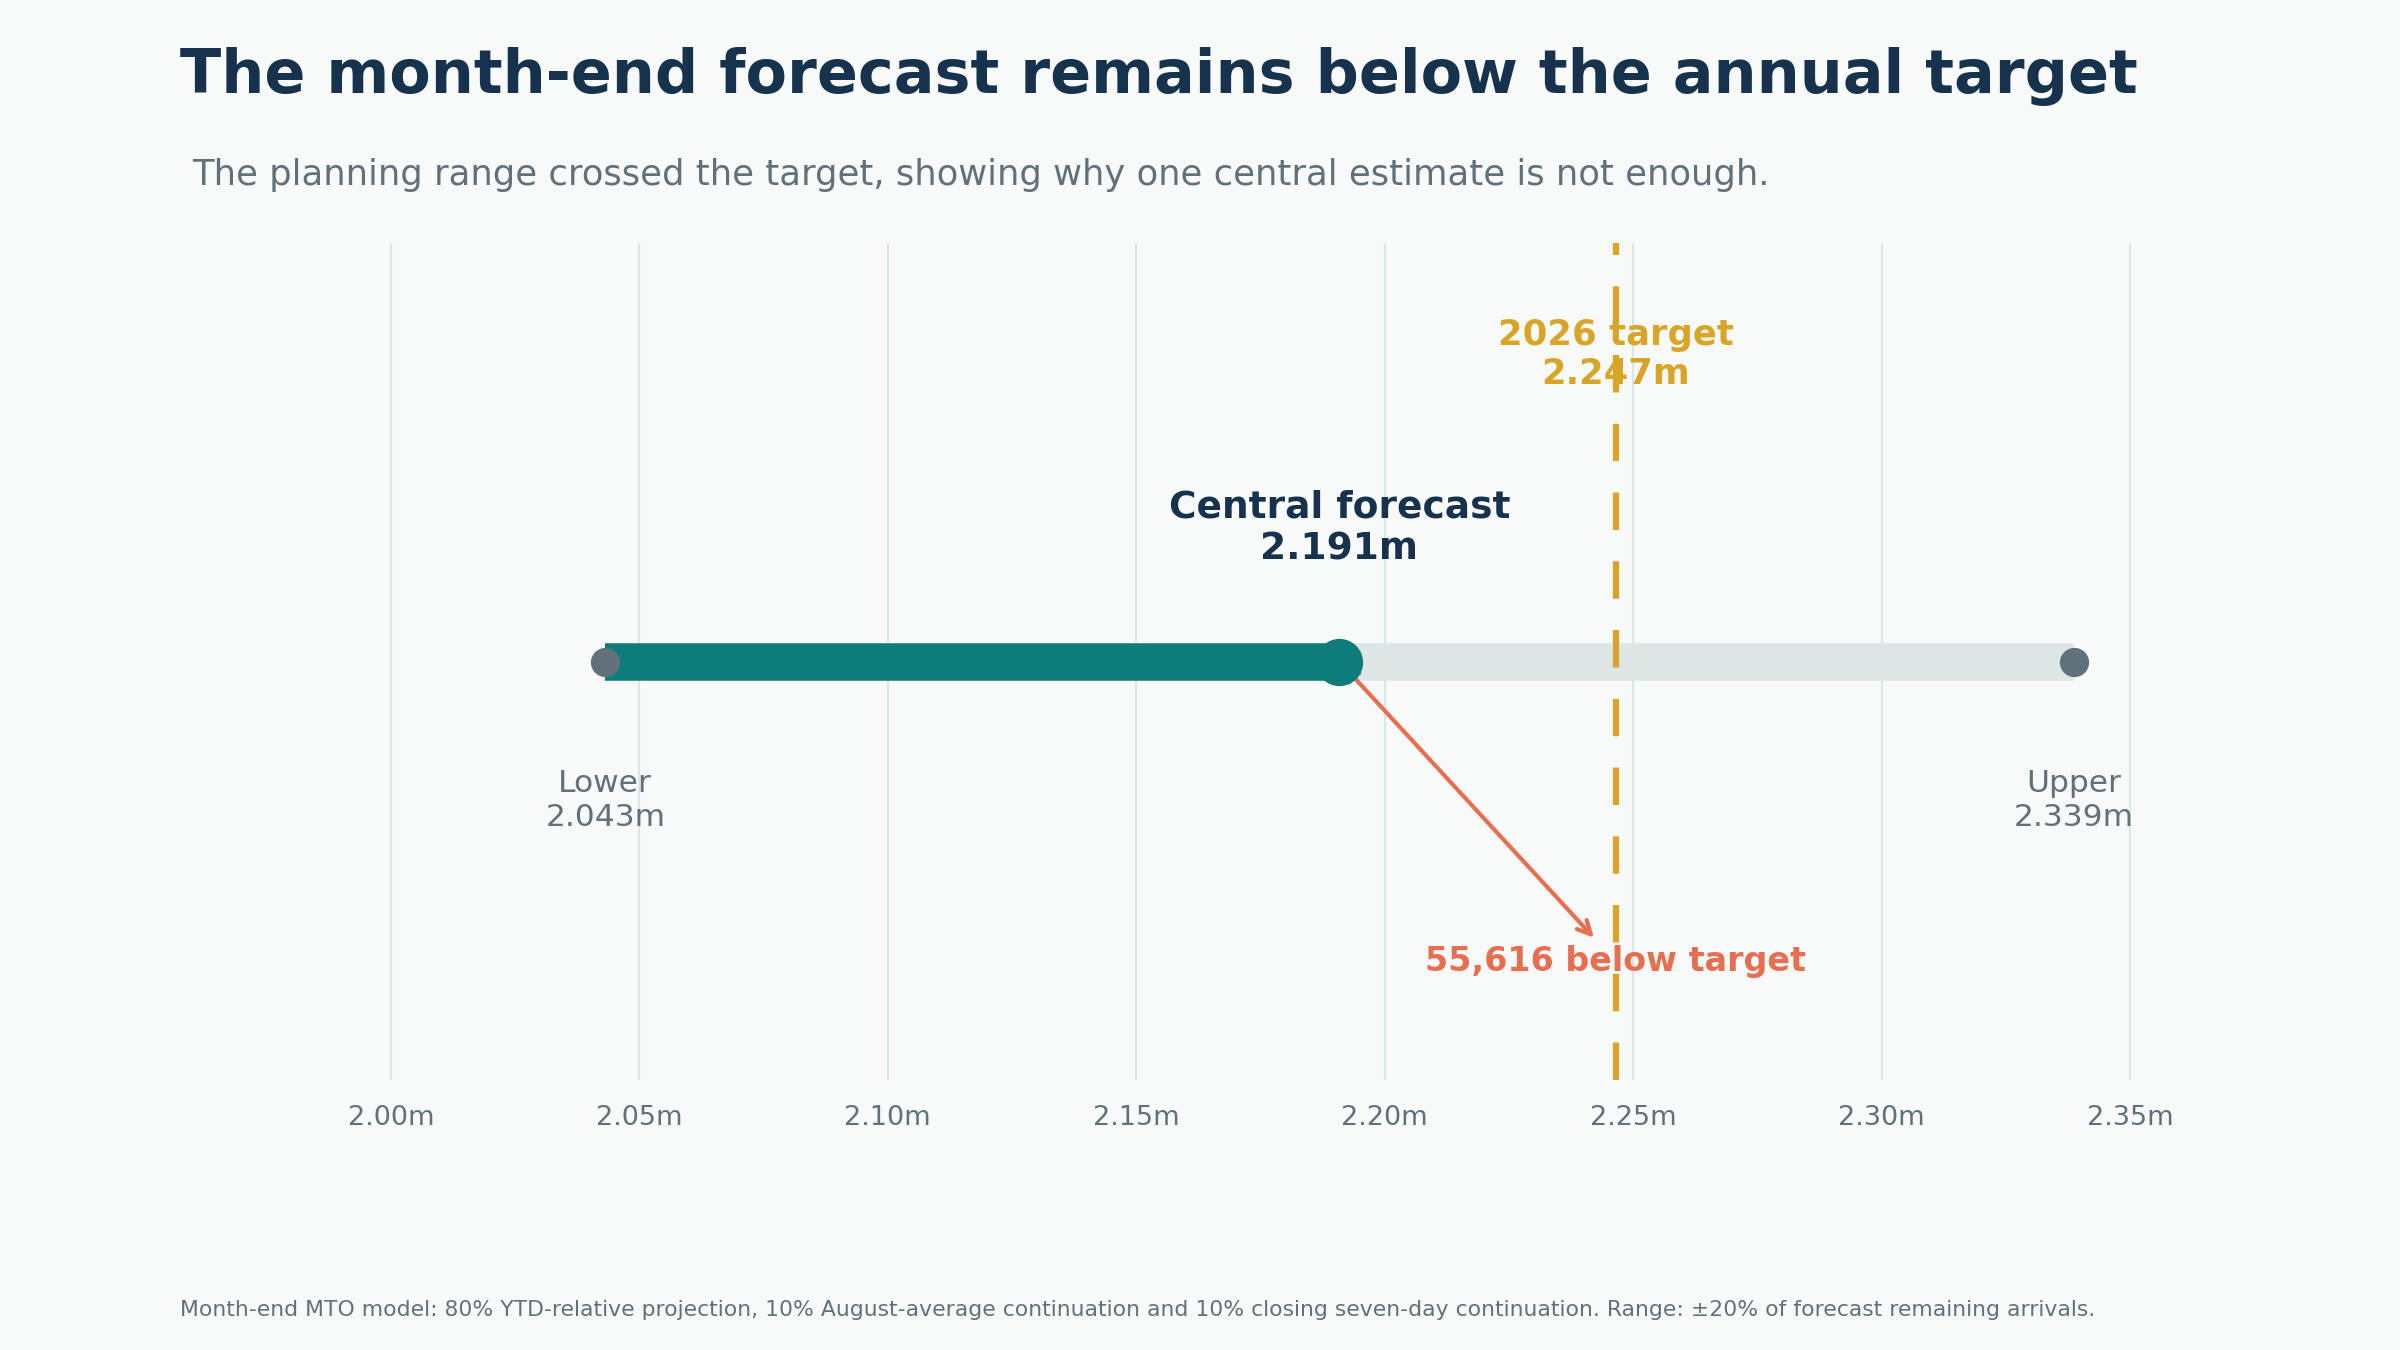
The wider planning range is approximately 2.043 million to 2.339 million arrivals. Its upper edge exceeds the target; its centre does not.
That distinction matters.
The target remains possible, but the current central case does not reach it. Doing so requires renewed momentum during the remaining four months rather than a continuation of the final August week.
This is also why forecasts should be treated as decision tools rather than promises. As I discussed in The Cancellation Policy That Makes Forecasts Lie, even apparently firm forward demand can contain different probabilities of actually materialising.
Arrivals still need to become occupied nights
There is another reason not to stop at the border-arrival total.
The latest available accommodation period recorded 59.7% occupancy, approximately 1.263 million bed nights sold, and roughly 854,000 unsold bed nights.
The MTO Capacity Pressure Index stood at 1.68×. In other words, the tourism system had 1.68 available bed nights for every bed night actually used.
This is the distinction explored in The Million Unsold Nights. A three-night visitor and a ten-night visitor each count as one arrival at the border. Economically, however, they generate very different accommodation demand. The same issue appears in the Maldives’ Seven-Night Tourism Reset: arrivals matter, but length of stay determines how effectively those arrivals are converted into bed nights, meals, transfers, activities and revenue.
So August's +5.2% arrival growth should be viewed as an opportunity for greater utilisation—not automatically as evidence that the accommodation economy strengthened by the same percentage.
Growth is also concentrated
China and Russia together accounted for 33.3% of accumulated arrivals, while 97.8% of visitors entered through Velana International Airport.
Concentration has advantages. Marketing can become more focused. Airline relationships can deepen. Route economics can improve. But concentration also creates exposure. A change in Chinese or Russian outbound behaviour can affect a large share of demand. A disruption affecting Velana can influence almost the entire international tourism system.
The longer market story is visible in What 20 Years of Maldives Arrivals Reveal: the Maldives has become more diversified over time, but it remains exposed to changing dominant markets.
Gateway concentration creates a similar relationship between tourism demand and infrastructure. In the Maldives, transport is not simply what happens before the holiday begins. The Seat Before the Villa explains why connectivity and onward transfers form part of the tourism product itself.
What September now needs to tell us
August’s recovery was real. So was its late deceleration. The next tourism release should therefore answer three questions.
Does the seven-day arrival pace recover towards or above 6,510 per day? Does visitor volume convert into stronger bed-night utilisation? And does growth broaden beyond the largest markets and the dominant international gateway?
For individual operators, national arrival data should also be read alongside their own forward indicators. Booking lead time can reveal whether demand is weakening or simply arriving later, while cancellation-adjusted bookings can show how much apparent future occupancy is genuinely secure.
If the late-August slowdown proves temporary and the final quarter accelerates, August may ultimately be remembered as the month when the annual gap began to close. If the weaker pace persists, the interpretation changes.
That is why the most useful lesson from August is not simply 197,640 tourists. It is that a monthly total tells us where tourism has been.
Momentum tells us where it may be going.