Maldives Tourism Brief: Third-Week August Demand Holds Above the Required Pace
21 Aug 2026, 06:20 · by IzuCT · 4 min read · Tourism · EN
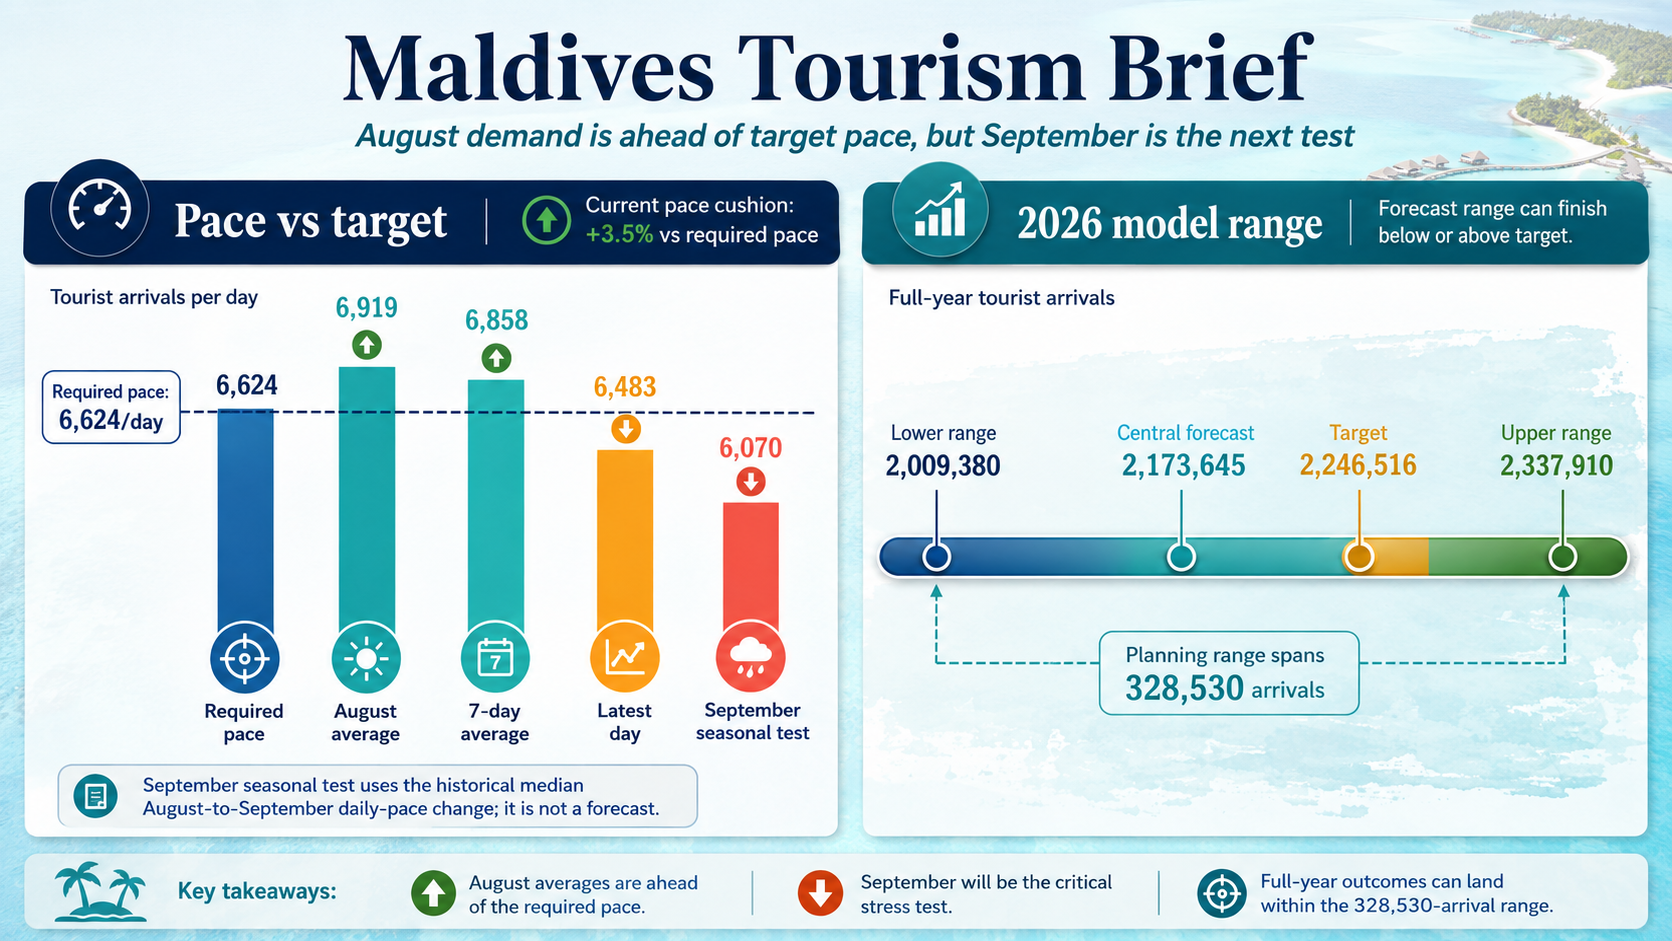
Maldives tourism entered late August with demand running above the pace needed for the 2026 target, but history suggests September usually softens. Industry should protect yield, sustain shoulder-season demand, diversify markets, and watch October’s rebound.
Free tourism insights
Get Free Tourism Insights
Receive selected MTO insights, tourism data alerts, and new resource updates by email.
Get Free Tourism InsightsTourism rarely moves in a straight line. It behaves more like a tide: advancing, retreating and advancing again, shaped by seasons, school calendars, air capacity, weather and the rhythms of distant economies.
Through 18 August 2026, the Maldives had received 1,352,320 tourists, 4.5% fewer than during the comparable period of 2025. Yet August itself is stronger: 124,534 arrivals in 18 days, averaging 6,919 tourists per day, or 2.7% above August 2025.
More importantly, the latest seven-day average of 6,858 arrivals per day remains above the 6,624 per day needed to reach the year-end target of 2,246,516.
But history adds an important qualification: September normally softens after August.
The numbers that matter
Indicator | Latest reading |
|---|---|
2026 arrivals to date | 1,352,320 |
YTD change vs 2025 | -4.5% |
August arrivals through 18 Aug | 124,534 |
August daily average | 6,919/day |
Seven-day average | 6,858/day |
Pace needed for target | 6,624/day |
Central 2026 forecast | 2,173,645 |
For the moment, the rolling pace carries a 234-tourist-per-day cushion, equivalent to about 3.5% above the required pace.
The danger is assuming that cushion will remain unchanged.
September usually interrupts the climb
Official Maldives Monetary Authority monthly data reveal a remarkably consistent seasonal feature. Across the non-pandemic comparison years 2015–2019 and 2022–2025, September arrivals were lower than August in every year.
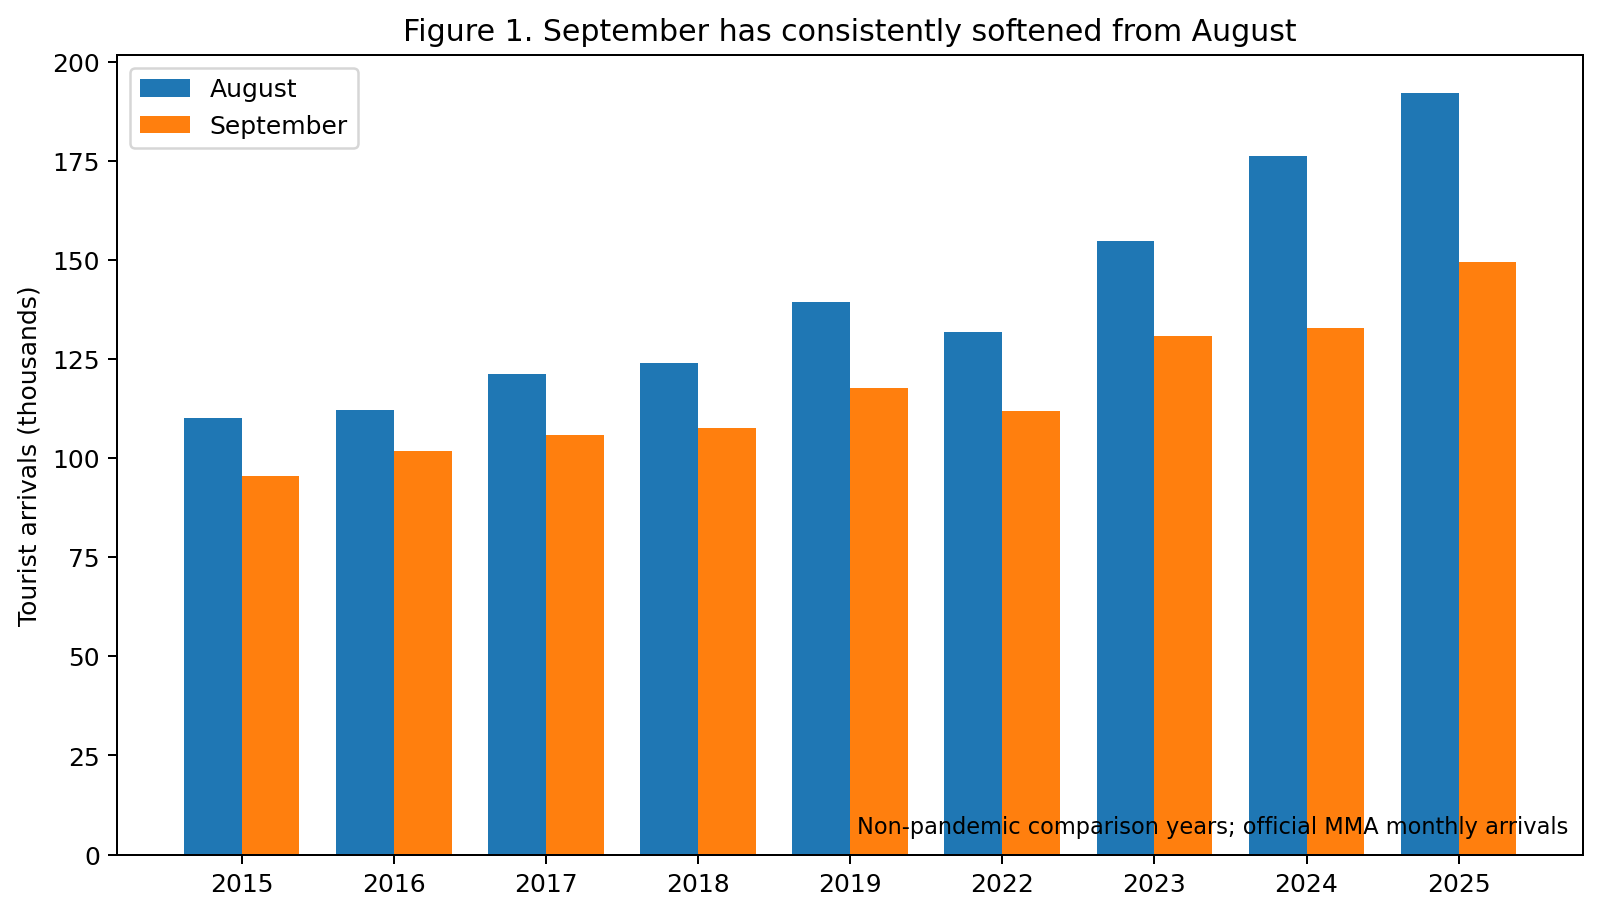
Tourist arrivals, thousands. Source: MMA/Ministry of Tourism.
The median reduction in total arrivals across these years was about 15%. Part of that difference simply reflects September having one fewer day, but even on a daily-rate basis the median decline was about 12%.
This should not automatically be interpreted as deteriorating demand. It is part of the seasonal architecture of Maldives tourism.
The historical pattern is more revealing when August is treated as an index of 100.
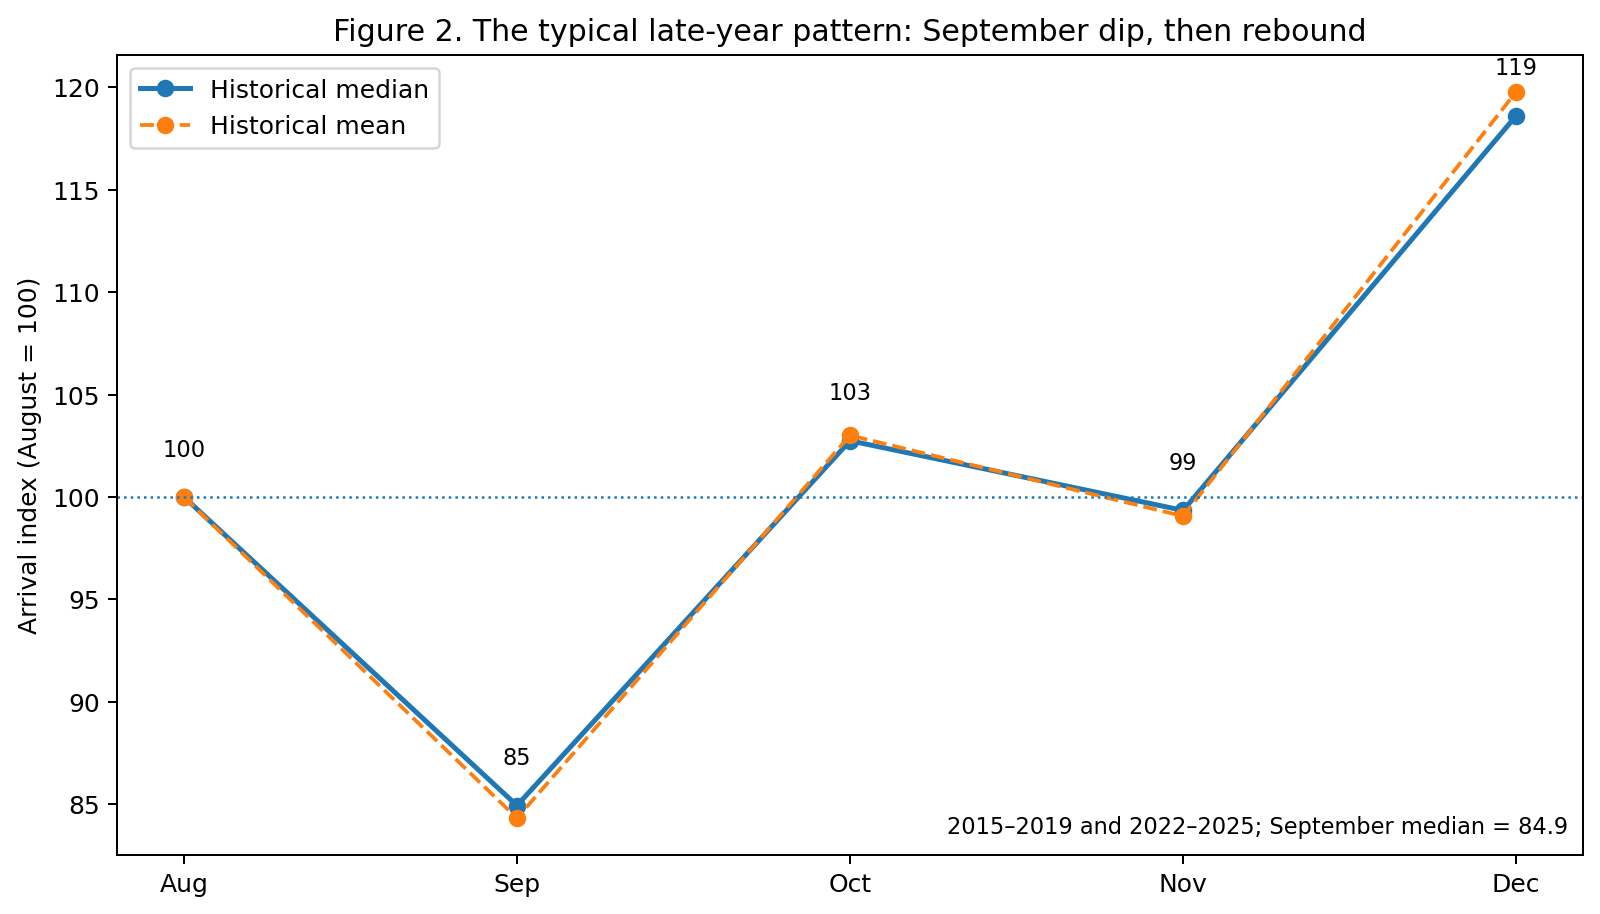
August = 100; median and mean for 2015–2019 and 2022–2025.
Historically, September forms a trough between August and the stronger final quarter. Demand generally turns upward again in October and November before reaching a much stronger level in December. MMA data show this recurring late-year recovery across the historical series.
For businesses, this distinction matters. September weakness can be seasonal rather than structural.
What would a normal September dip mean in 2026?
A simple seasonal stress test illustrates the risk.
If the current August average of 6,919 arrivals per day experienced the historical median August-to-September change in daily pace, September would run at roughly 6,070 arrivals per day.
That would fall temporarily below the 6,624/day pace required for the year-end target.
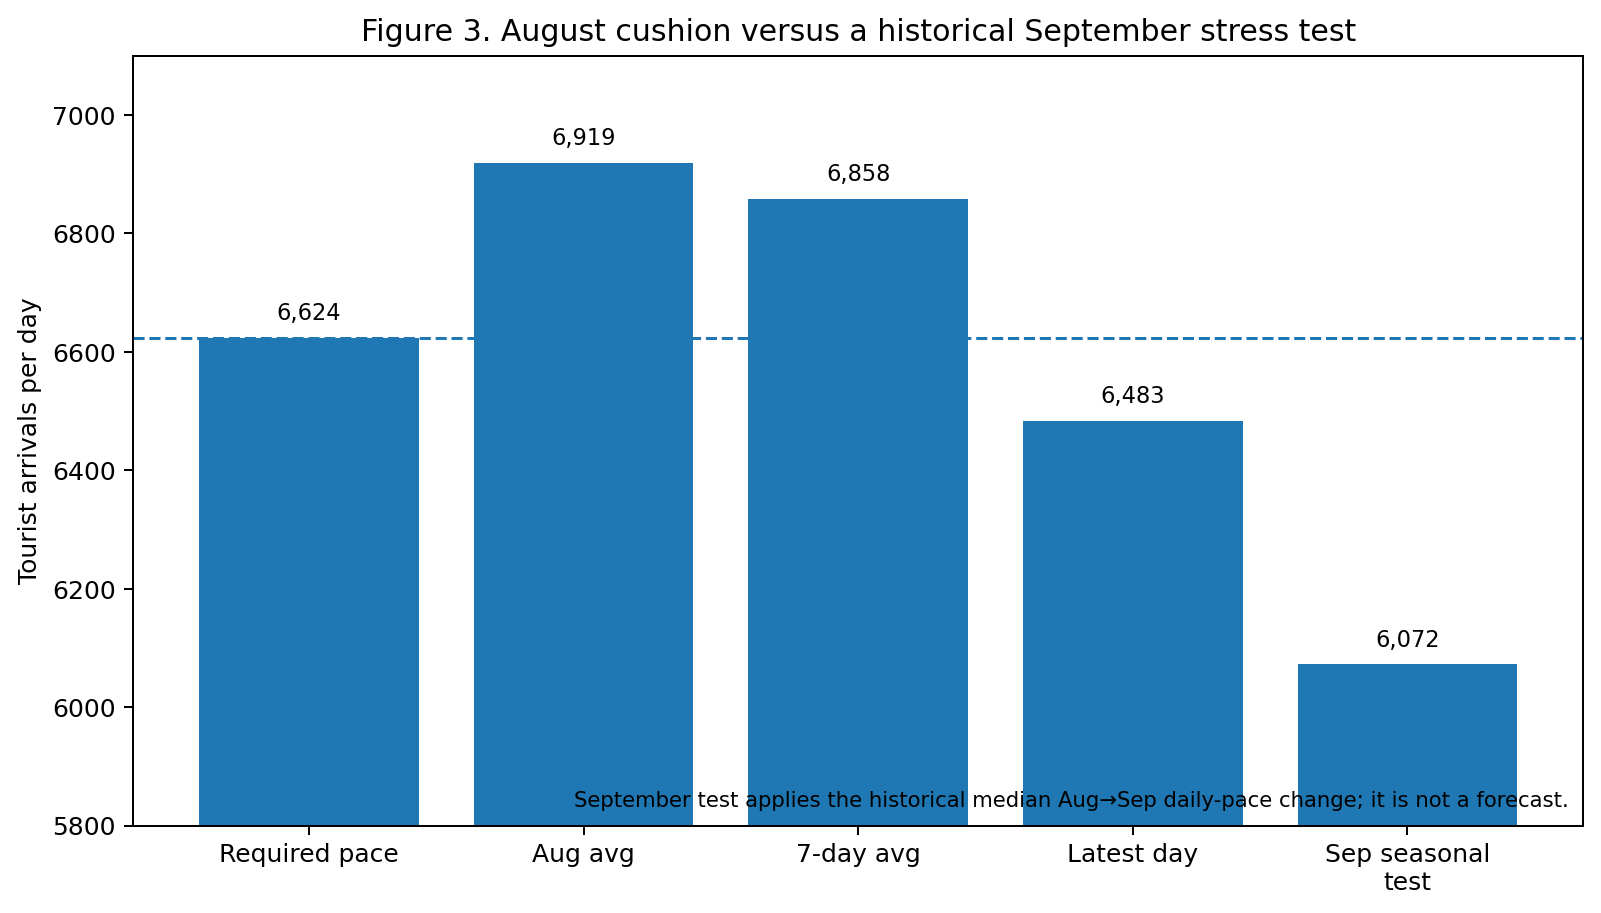
The September value is a historical stress test, not a forecast.
This is perhaps the most important operational signal in the brief.
August's positive pace cushion is real, but it is not large enough to absorb a typical September slowdown without briefly falling below the target trajectory.
That does not mean the target becomes impossible. Historically, the stronger October–December period provides the system with another acceleration window. It does mean that September deserves careful management.
The forecast still contains substantial uncertainty
The central model currently projects 2,173,645 arrivals for 2026, around 72,871 below the 2,246,516 target.
The planning range remains wide:
Scenario | Full-year arrivals | Difference from target |
|---|---|---|
Lower range | 2,009,380 | -237,136 |
Central forecast | 2,173,645 | -72,871 |
Upper range | 2,337,910 | +91,394 |
The 328,530-arrival spread between the lower and upper scenarios is a reminder that forecasts are decision tools, not promises.
The historical September pattern should therefore be treated as an additional seasonal stress test rather than mechanically substituted into the forecasting model.
The signal to watch
Three numbers now matter most: the September daily pace, the seven-day rolling average, and the speed of the October rebound.
If September declines modestly while remaining consistent with historical seasonality, the story is not demand failure. If the decline is substantially deeper, lasts longer, or is followed by a weak October recovery, the interpretation changes.
The Maldives enters this period with momentum—but also with very little room to confuse a seasonal tide with a permanent change in the ocean.
--
Method and source note
The central forecast blends comparable YTD performance, current-month momentum and the latest seven-day pace. The 2,009,380–2,337,910 interval is a planning range, not a guarantee. The September stress test uses the historical August-to-September change in daily arrivals for 2015–2019 and 2022–2025, excluding the pandemic-distorted years 2020 and 2021. Historical monthly arrivals are from the Maldives Monetary Authority, sourced from the Ministry of Tourism.
Current-data source: Daily Updates – 19 August 2026.pdf, data through 18 August 2026.